Stop guessing what buyers want. Start knowing.
As a real estate agent, you’ve probably asked yourself: “What actually makes buyers interested in my listing?” You update photos, adjust the price, tweak the description—but without data, you’re flying blind. You don’t know which changes made a difference and which were a waste of time.
That changes now.
Introducing Listing Engagement Metrics—a powerful analytics tool that shows you exactly how buyers are interacting with your listings and, more importantly, how your actions impact that engagement.
What You’re Looking At
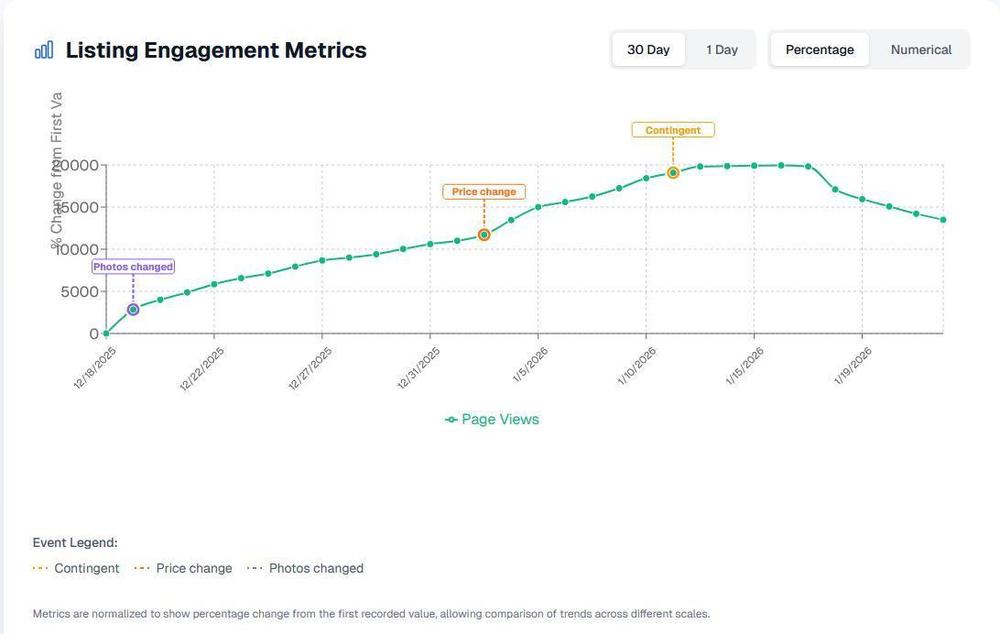
The Engagement Metrics dashboard showing page views over time with key events marked
The chart above tells a story. Let’s break down what you’re seeing:
The Line Graph: Tracks your listing’s page views over time, showing the percentage change from when tracking began
Event Markers: Colored annotations that pinpoint exactly when something changed on your listing
🟣 Photos changed — When you updated or added new photos
🟠 Price change — When the listing price was adjusted
🟡 Contingent — When the listing went under contract
Toggle Controls: Switch between 30-day cumulative trends or 1-day snapshots, and view data as percentages or raw numbers
Pinpointing What Moves the Needle
Here’s where it gets powerful. Look at the chart again:
The Photos Changed Event
Notice how engagement started climbing right after the “Photos changed” marker? This listing saw steady, consistent growth in page views following a photo update. That’s not a coincidence—that’s data showing you that better photos = more eyeballs. That’s why you shouldn’t skip media from day 1.
Related: Learn why first impressions matter and how to choose the right cover photo for maximum impact.
The Price Change Effect
When the price was adjusted, there’s a visible inflection point. You can see engagement accelerating. This tells you the market was responding positively to the new price point.
The Contingent Status
Once the listing went contingent, you see the pattern shift. Engagement peaked and then began to taper—which makes sense. Serious buyers move on when they see “contingent,” while curious browsers might still check in.
The takeaway? You can now trace every engagement spike or dip back to a specific action. No more wondering “did that work?” You’ll know.
A/B Testing Your Way to Success
Here’s where savvy agents separate themselves from the pack: treating your listings like experiments. (In a postive way)
How to Run Your Own Tests
Photo Testing
Upload a new set of photos (or reorder your existing ones with a stronger lead image)
Watch engagement for 5-7 days
Compare the before/after trend lines
Keep what works, iterate on what doesn’t
Pro Tip: Make sure your photos are optimized for Zillow’s cropping to maximize click-through rates.
Price Strategy Testing
Make a strategic price adjustment
Monitor the immediate engagement response (use the “1 Day” toggle for granular data)
Assess whether the change attracted more views or scared buyers away
Timing Experiments
Does engagement spike on certain days of the week?
Toggle to “Numerical” mode to see actual view counts
Use the 1-day view to spot daily patterns
Reading the Results
30 Day view + Percentage mode: Best for seeing overall trends and the cumulative impact of changes
1 Day view + Numerical mode: Best for measuring immediate reactions to a change
Combine both: Make a change, monitor the 1-day reaction, then track the 30-day trend to see if momentum holds
Getting Your Listings to the Closing Table
Engagement metrics aren’t just vanity numbers—they’re leading indicators of listing health. Here’s how to use them strategically:
Identify Struggling Listings Early
If engagement is flat or declining, your listing needs attention. The metrics give you early warning so you can take action before the listing goes stale.
Know When to Act
Flat engagement + high days on market = Time for a significant change (price drop, new photos, or both)
Declining engagement after initial spike = The “new listing” bump wore off; refresh the listing to recapture interest
Steady climb = You’re on the right track; don’t make unnecessary changes
Connect Actions to Outcomes
When a listing finally goes pending or sold, you’ll have a complete picture of what drove the success. Was it the photo refresh in week two? The price adjustment in week three? Now you know—and you can replicate that strategy on future listings.
Communicate Value to Sellers
Imagine showing your sellers a chart like this during your weekly update: “See this spike? That’s from the professional photos we added. And this uptick? That’s the market responding to our price adjustment strategy.”
Data builds trust. Trust wins listings.
Start Tracking Today
Getting started with engagement tracking is simple: book a shoot with us. Once your shoot is complete, we’ll set up tracking for your listing and follow up with a metrics link.
Important to know: Engagement tracking is not guaranteed. Tracking may fail to pull metrics if:
- The order address is different from the listing address
- The listing is a commercial property
We’ll follow up with a metrics link once tracking is active, and send quarterly reminders to review your metrics so you can stay on top of your listing’s performance.
The Bottom Line
In a competitive market, the agents who win are the ones who work smarter, not just harder. Engagement metrics give you the intelligence to:
Understand what buyers actually respond to
Test different strategies with real data
Optimize your listings for maximum exposure
Close more deals by keeping listings fresh and engaging
Stop guessing. Start measuring. Get to the closing table faster.
Ready to get started? Submit your order today and get engagement tracking included with your shoot.